Question 56
Previous Year Question
ISRO CSE 2020
PYQ
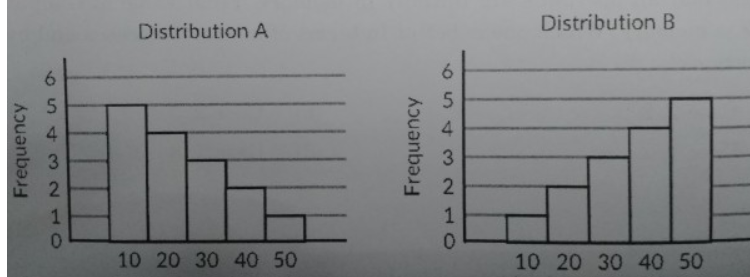
For the distributions given below : Which of the following is correct for the above distributions?
Solution & Detailed Explanation
Step-by-Step Solution
1
Step-by-Step Analysis:
Standard deviation measures the dispersion or spread of data points relative to their central mean. It depends entirely on the shape and spread of the distribution, not on whether the values lean toward the higher or lower end of the scale.
2
CODE
Observe the Shapes:
	• Distribution A has frequencies of [5, 4, 3, 2, 1] for the values [10, 20, 30, 40, 50].
	• Distribution B has frequencies of [1, 2, 3, 4, 5] for the same values [10, 20, 30, 40, 50].
3
CODE
Mirror Images:
	• Distribution B is a perfect horizontal reflection (mirror image) of Distribution A.
	• While their means (averages) are different—Distribution A's mean is pulled toward the lower side (\(23.33\)) and Distribution B's mean is pulled toward the higher side (\(36.67\))—the distance of the bars relative to their respective means is identical.
4
CODE
Conclusion:
	• Because the two datasets have identical frequency structures and variation profiles, their deviations from their means are perfectly symmetrical.
	• Consequently, the variance and standard deviation of both distributions are exactly the same.
✓ Saved